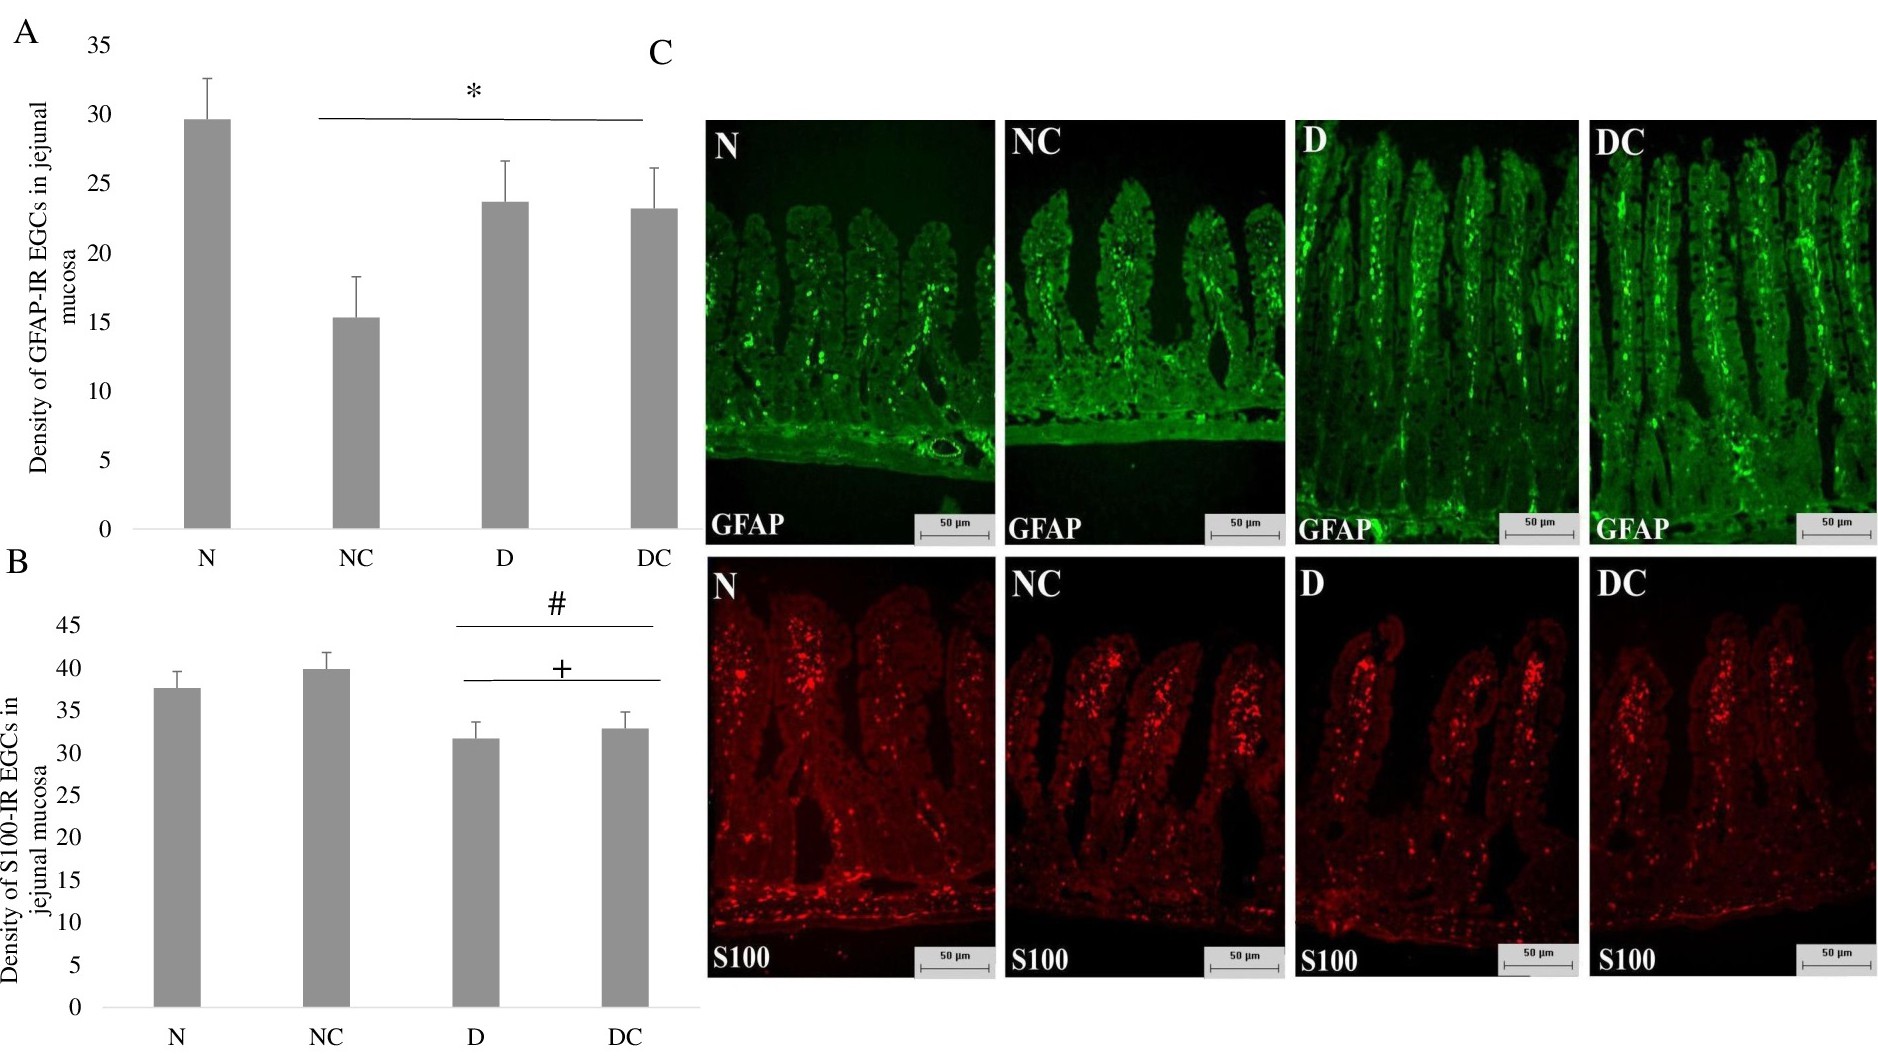
Fig. 4. (A, B) Mean density of GFAP-IR EGCs (A) and S100-IR EGCs (B) per villus in the jejunal mucosa. (C) Representative photomicrographs of GFAP and S100 protein immunostaining in the jejunal mucosa in the N, NC, D, and DC groups. Scale bar = 50 μm. The results are expressed as mean ± SEM. n = 6 rats/group. *p<0.001, compared with N group; #p<0.02, D and DC groups compared with N group; +p<0.0003, D and DC groups compared with NC group.